Valerix
- RabbitMQ
- Prometheus
- Microservices
Champion, BUET CSE Fest 2026.
The problem
In a distributed system, the dangerous failure is rarely a crash. A service that hangs is worse: callers wait, requests pile up, and the user sees a spinner or an error. Valerix is a small e-commerce flow (Order to Inventory) built to show how to keep working when a dependency gets slow or disappears.
It was built for BUET CSE Fest 2026, where it won the championship. The order flow is deliberately simple so the resilience patterns around it stay in focus.
How an order flows
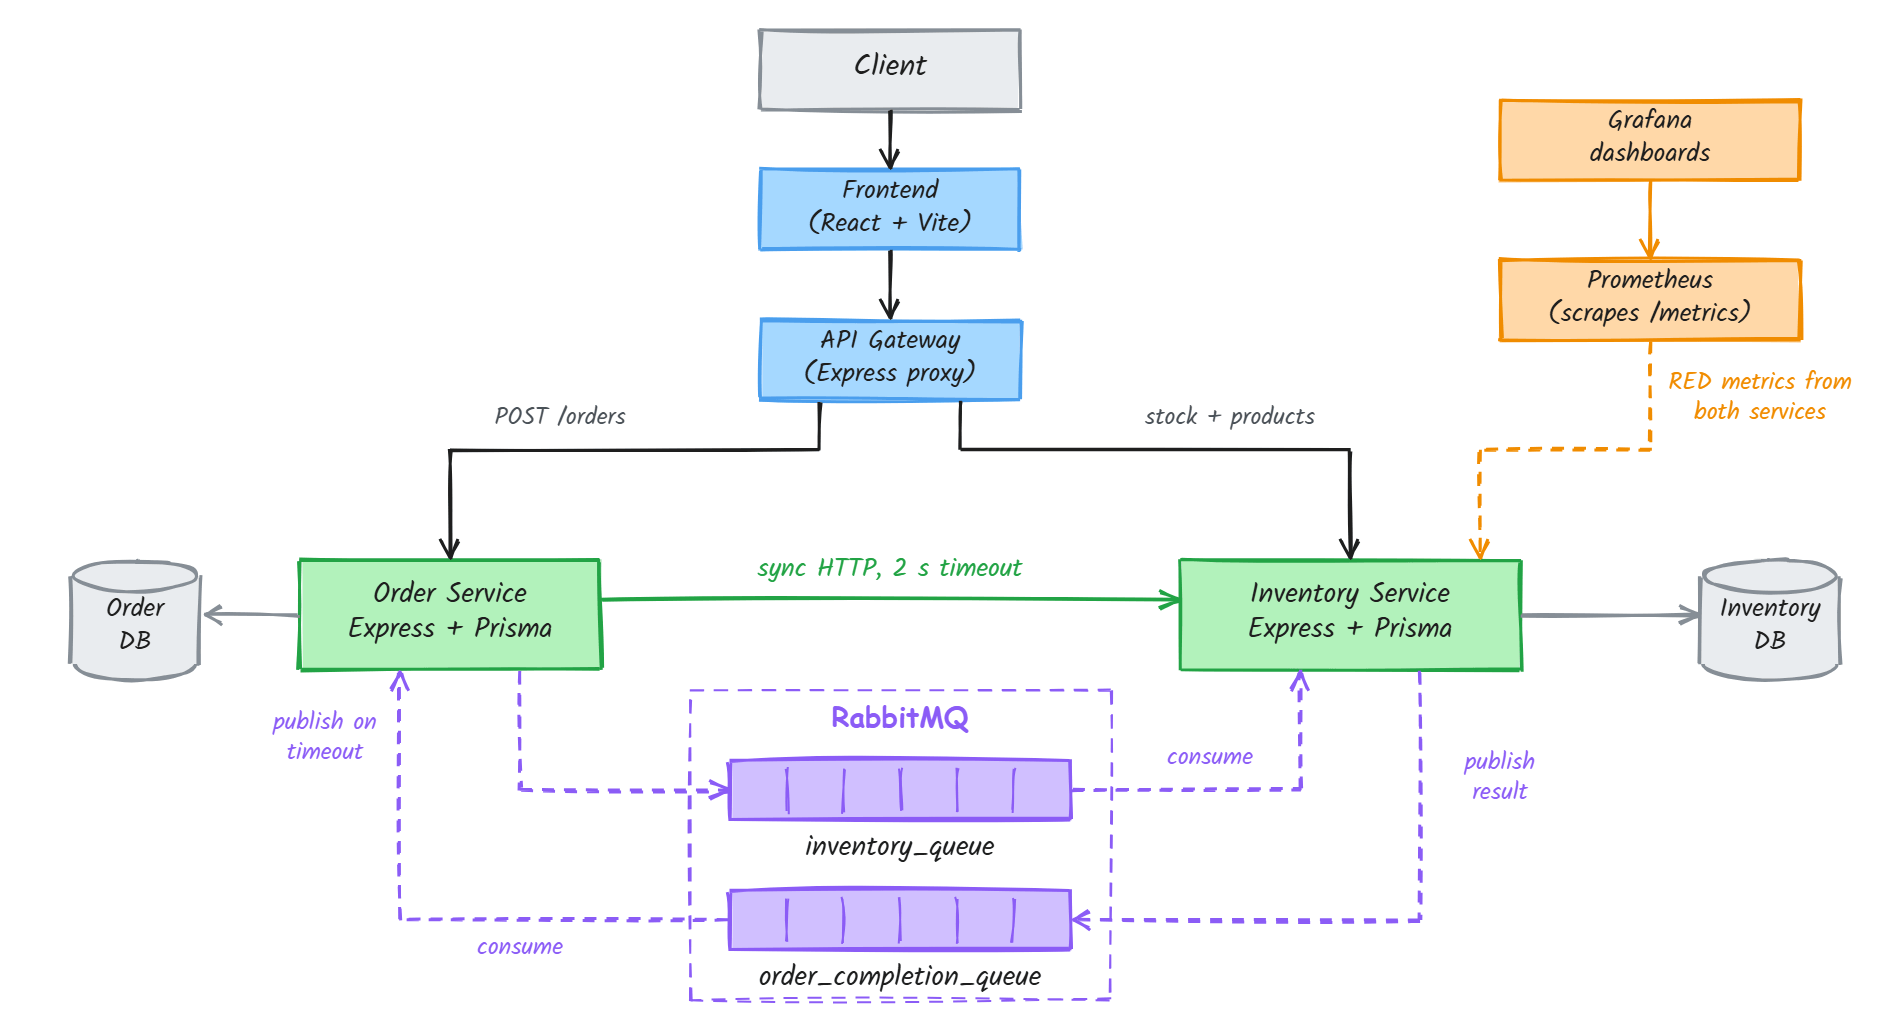
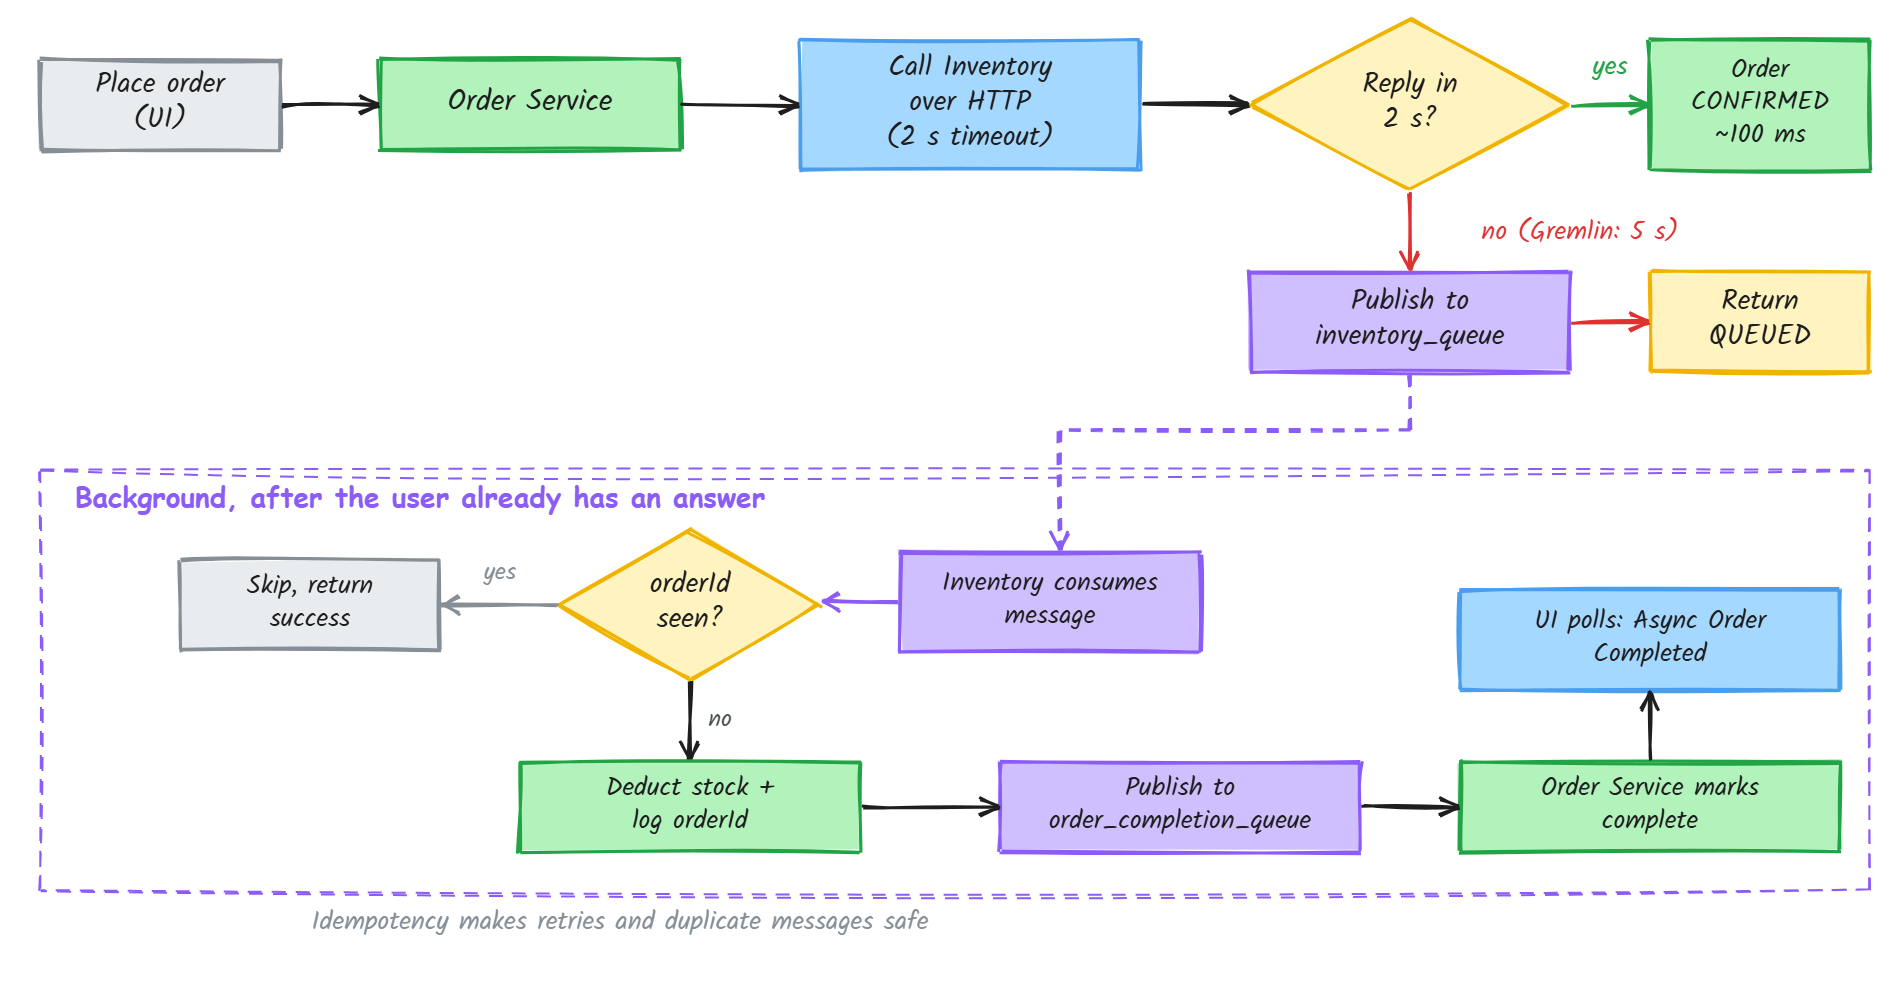
On the happy path, the Order Service calls the Inventory Service over HTTP and deducts stock immediately. The order is confirmed in roughly 100 ms.
The call has a strict 2 second timeout. If Inventory does not answer in time, the Order Service stops waiting, publishes the order to a RabbitMQ queue and returns QUEUED to the user straight away. Inventory consumes the message in the background, updates stock, and publishes the result to a second queue. The frontend polls and shows the order as completed once the result arrives.
The resilience patterns
- Timeout and asynchronous fallback. A slow dependency costs the user a "queued" status instead of a hung request or a failed order.
- Idempotent processing. Retries and duplicate messages can double-deduct stock. Inventory records every processed
orderIdin anIdempotencyLogtable, so seeing the same order again returns success without touching stock. - Connection retries. Both services keep retrying their connection to RabbitMQ, so start-up order does not matter and the system recovers if the broker restarts.
- Fault injection. Real services hang rather than fail cleanly, so Valerix can fake it on demand. A "Gremlin" flag makes Inventory sleep for 5 seconds, well past the 2 second timeout, which forces the fallback path every time.
Proving it works
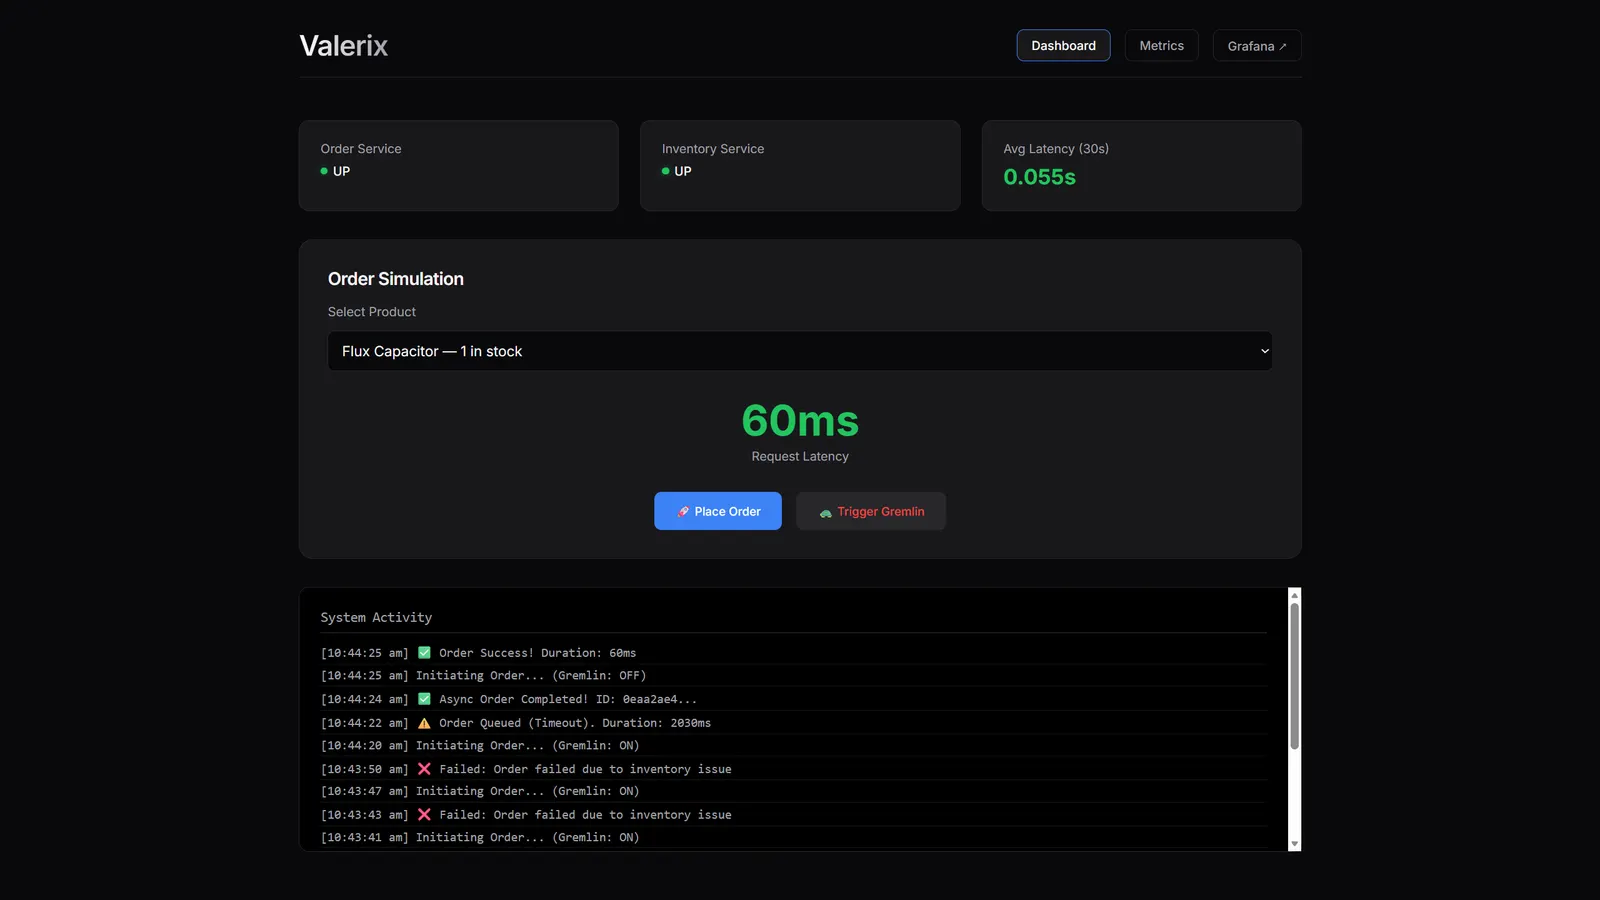
The dashboard exists to make the failure and the recovery visible. Placing a normal order confirms in around 100 ms with a green latency indicator. Triggering the Gremlin pushes the order through the fallback: the UI shows QUEUED, the average latency badge turns red, and a few seconds later the order resolves to completed once the background consumer has processed it.
Observability
- Live alerts. The dashboard keeps a moving average of request latency over a 30 second window and raises a red alert when it spikes. Traffic-light indicators show whether each service is up.
- Prometheus metrics. Each service exposes
/metrics, following the RED method (rate, errors, duration), including request duration histograms and process statistics. - Metrics view. A dedicated page in the frontend parses the raw Prometheus output into CPU, memory, heap and uptime cards.
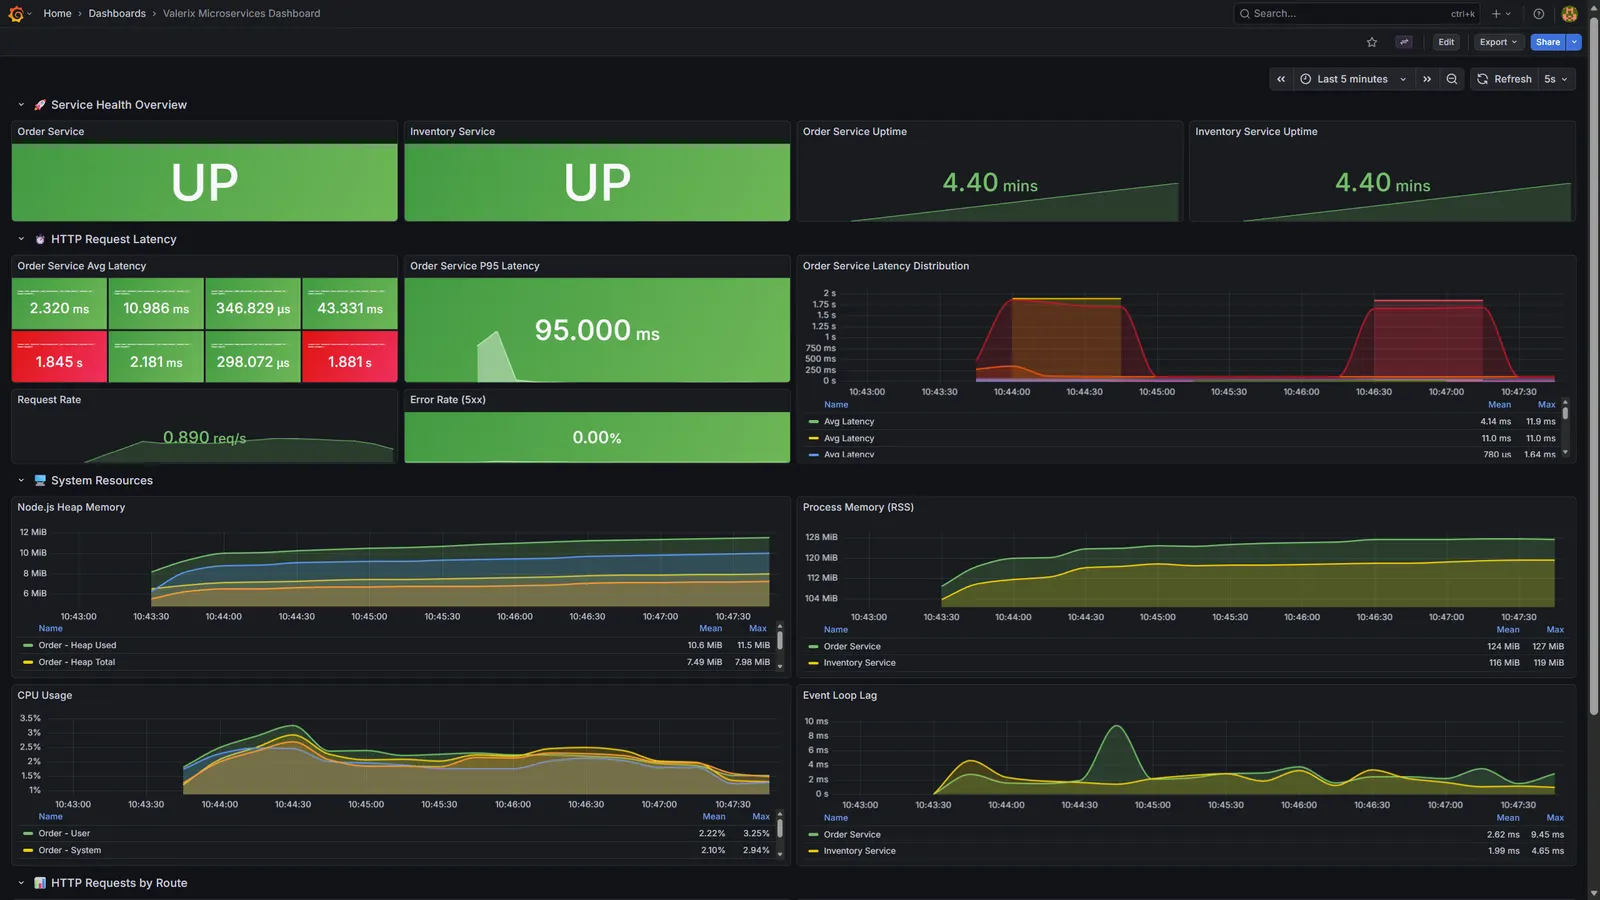
- Grafana. A dashboard covers service health, latency percentiles, request rate, error rate, memory, CPU and event loop lag.
Architecture and delivery
The system is a set of independent containers orchestrated with Docker Compose: a React and Vite frontend, an Express API gateway, the Order and Inventory services (Node.js, Express and Prisma, each with its own PostgreSQL database), RabbitMQ, Prometheus and Grafana. Kubernetes manifests are included for deployment behind an nginx ingress.
A GitHub Actions workflow builds and starts the whole stack, waits for both services to report healthy, seeds inventory, and runs a load test against the Order Service that flags slow and failed requests.
Limits
Valerix is a demonstration, not a production shop. The catalogue is a seeded set of products, and the failure it injects is latency from a single flag rather than the full range of real-world faults.